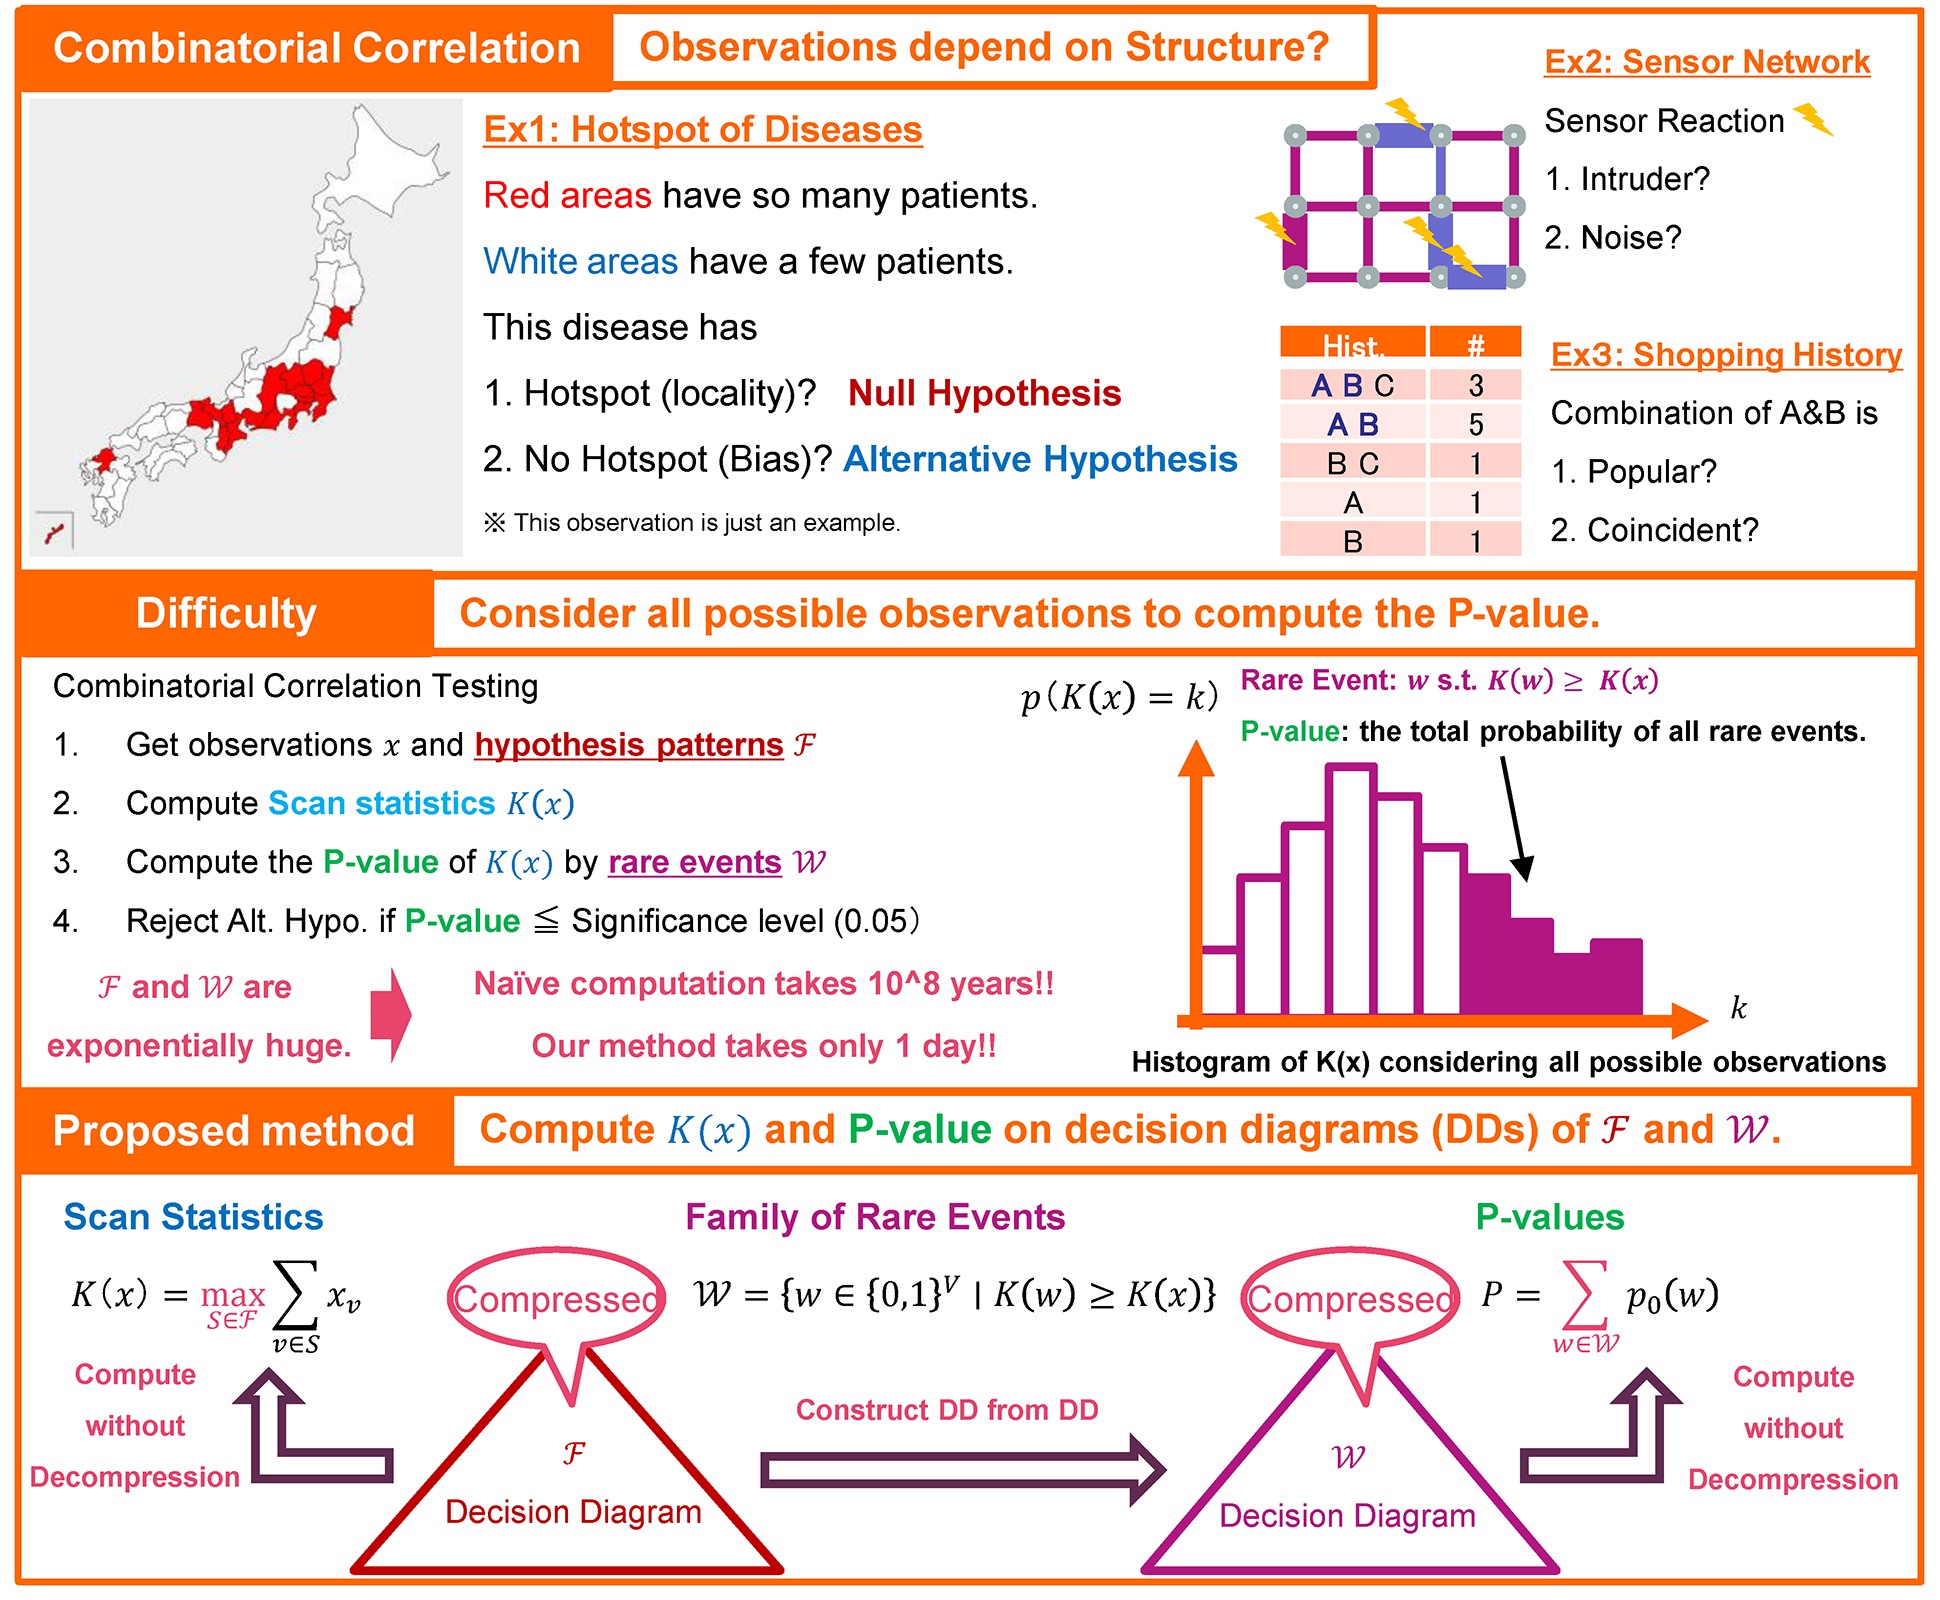
Abstract
We sometimes observe data with structures; population changes of cities on a map, traffic densities of roads on a traffic network, and reactions of sensors on a sensor network. Then, it is a natural question that the observations depend on the structure or not. Testing combinatorial correlation is a statistical method to answer the question: however, the test generally requires the exponential time because it considers all possible observations to evaluate the rarity of the current observation. In this research, we propose an efficient testing method using decision diagrams (DDs) that are a compact representation of a family of sets. We first compress the hypothesis patterns, which define the structure of the observations, by a DD and then construct another DD that compresses rare events to evaluate the rarity of the current observations. Our method reduces the testing time from 10^8 years to only 1 day in the case of testing binary observations on the Japanese prefecture map.
Masakazu Ishihata / Learning and Intelligent Systems Research Group, Innovative Communication Laboratory
Email: